Searching for and visualizing logs
In this example scenario, your organization's robot operators and technicians have noticed an increase in optical encoder failures over time in the fleet and asked for help with investigating the root cause. They opened a ticket providing details on the robot requiring replacement.
Robot ID: ROBO3396
Date of failure: 09/03/2024
Date of replacement: 09/04/2024
You would like to analyze data from the last run of the robot before the failure.
To search for logs from that specific robot, begin by searching by Robot ID.
- Navigate to the Search page by clicking on
Searchin the left navigation menu.
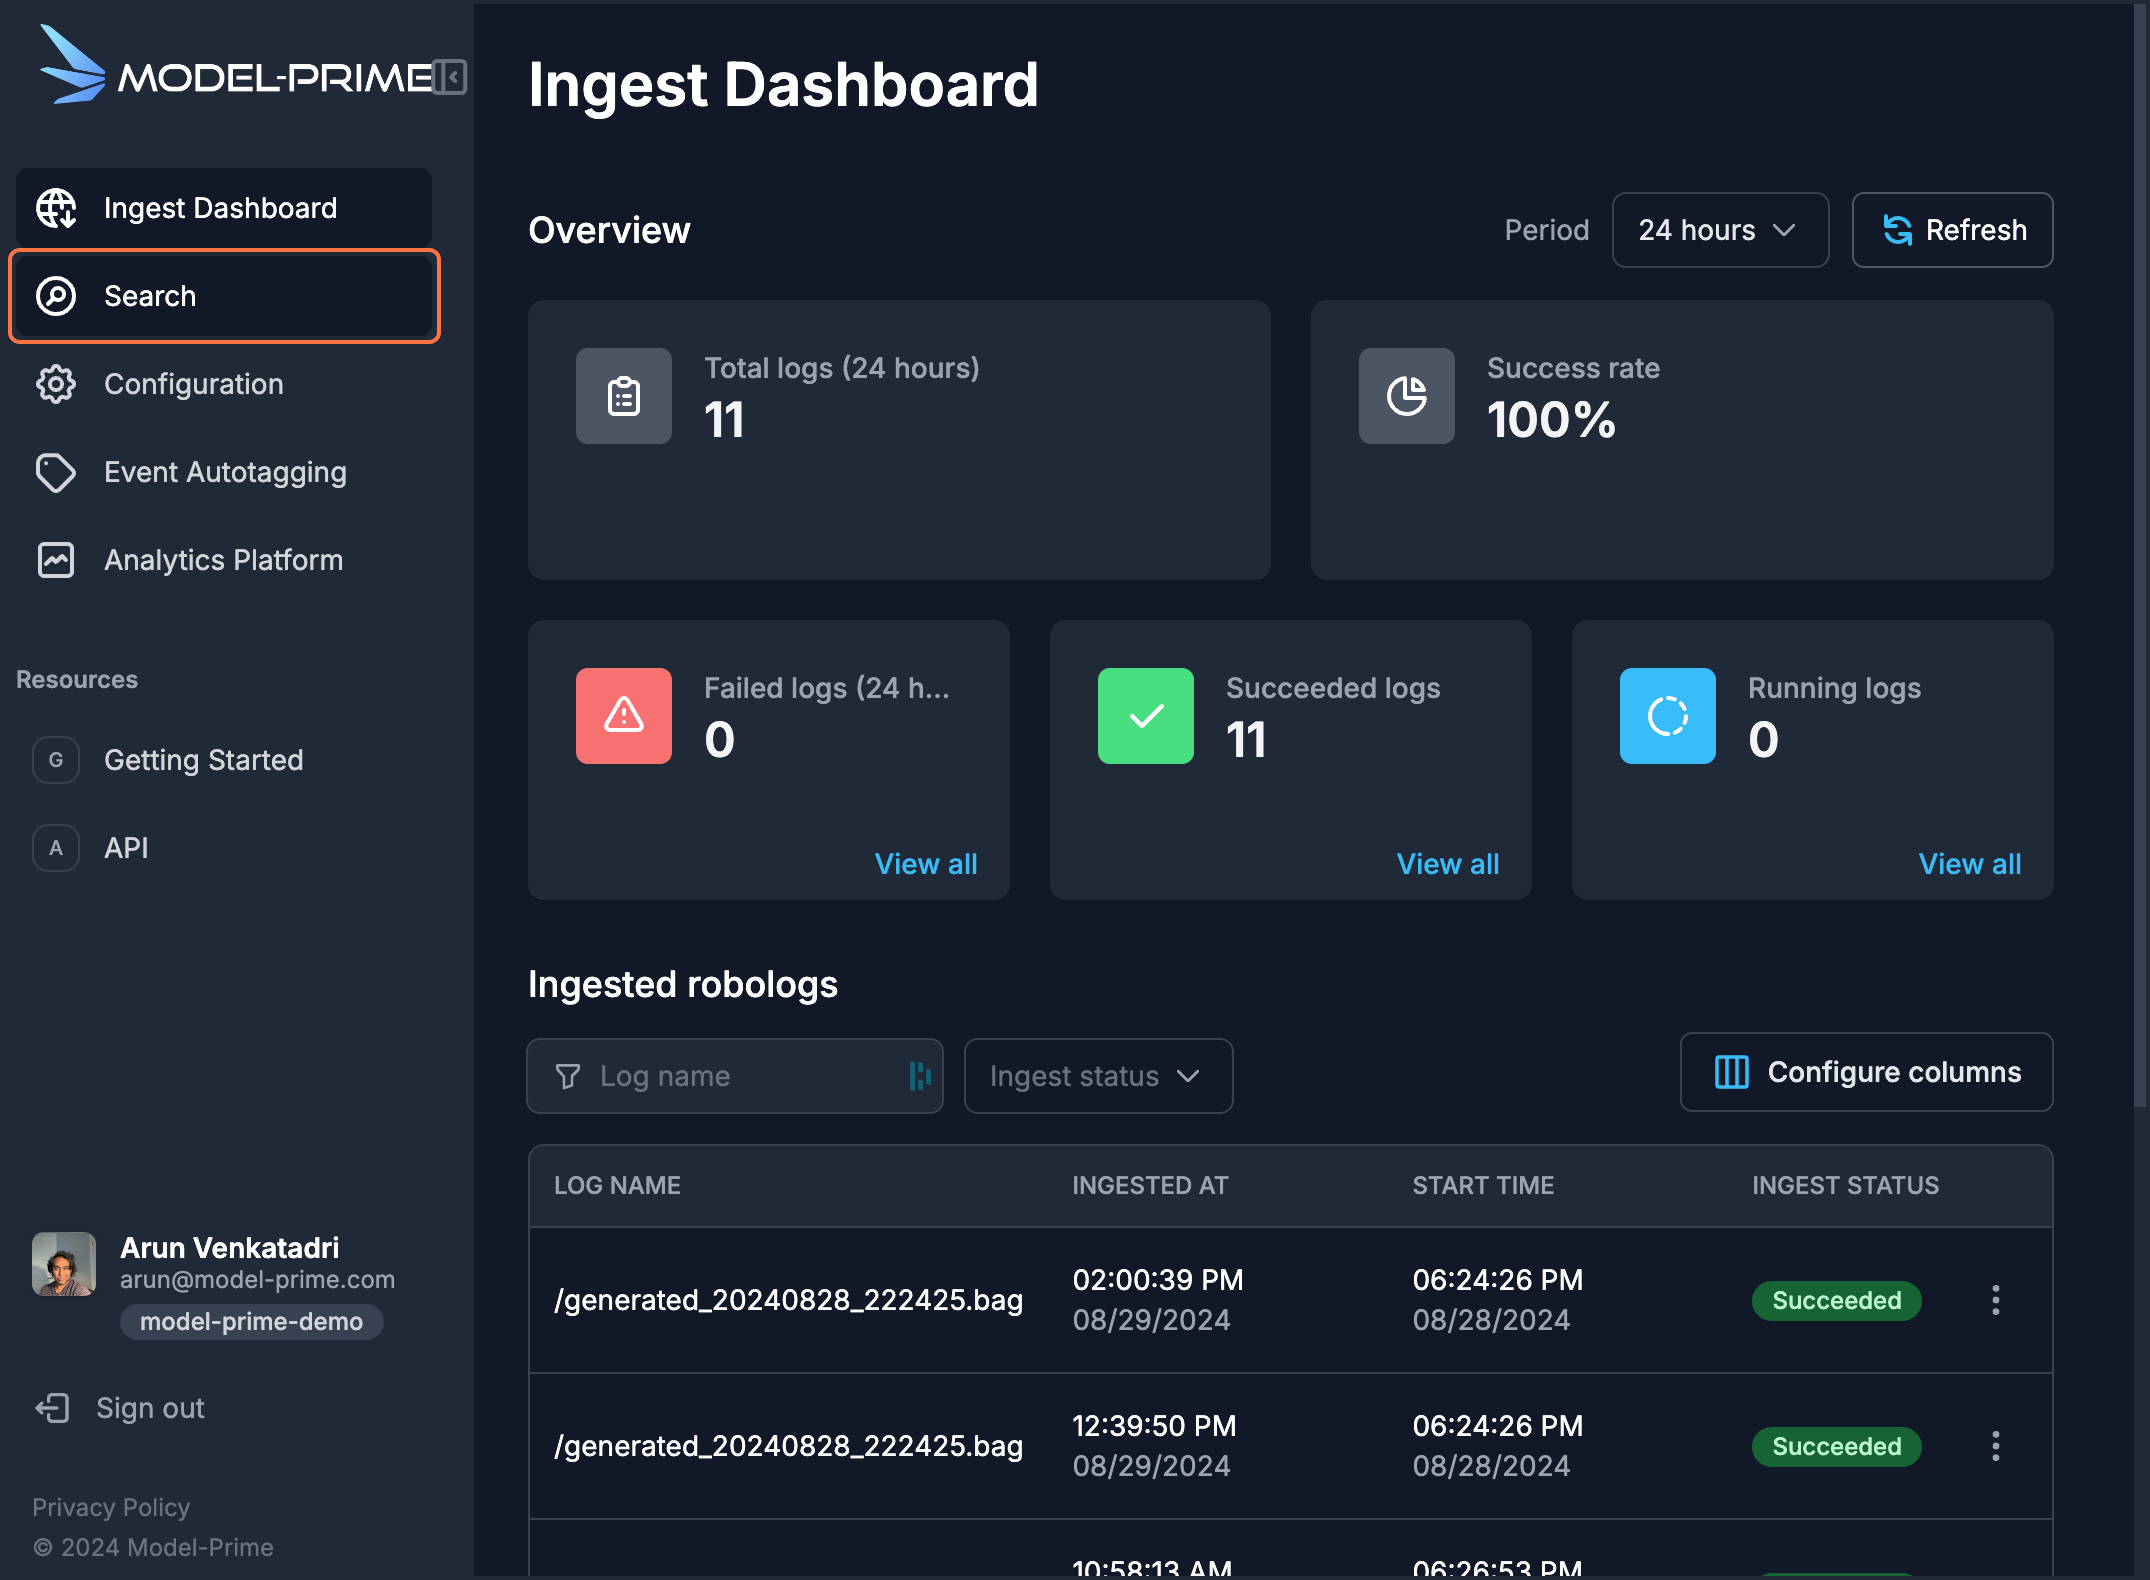
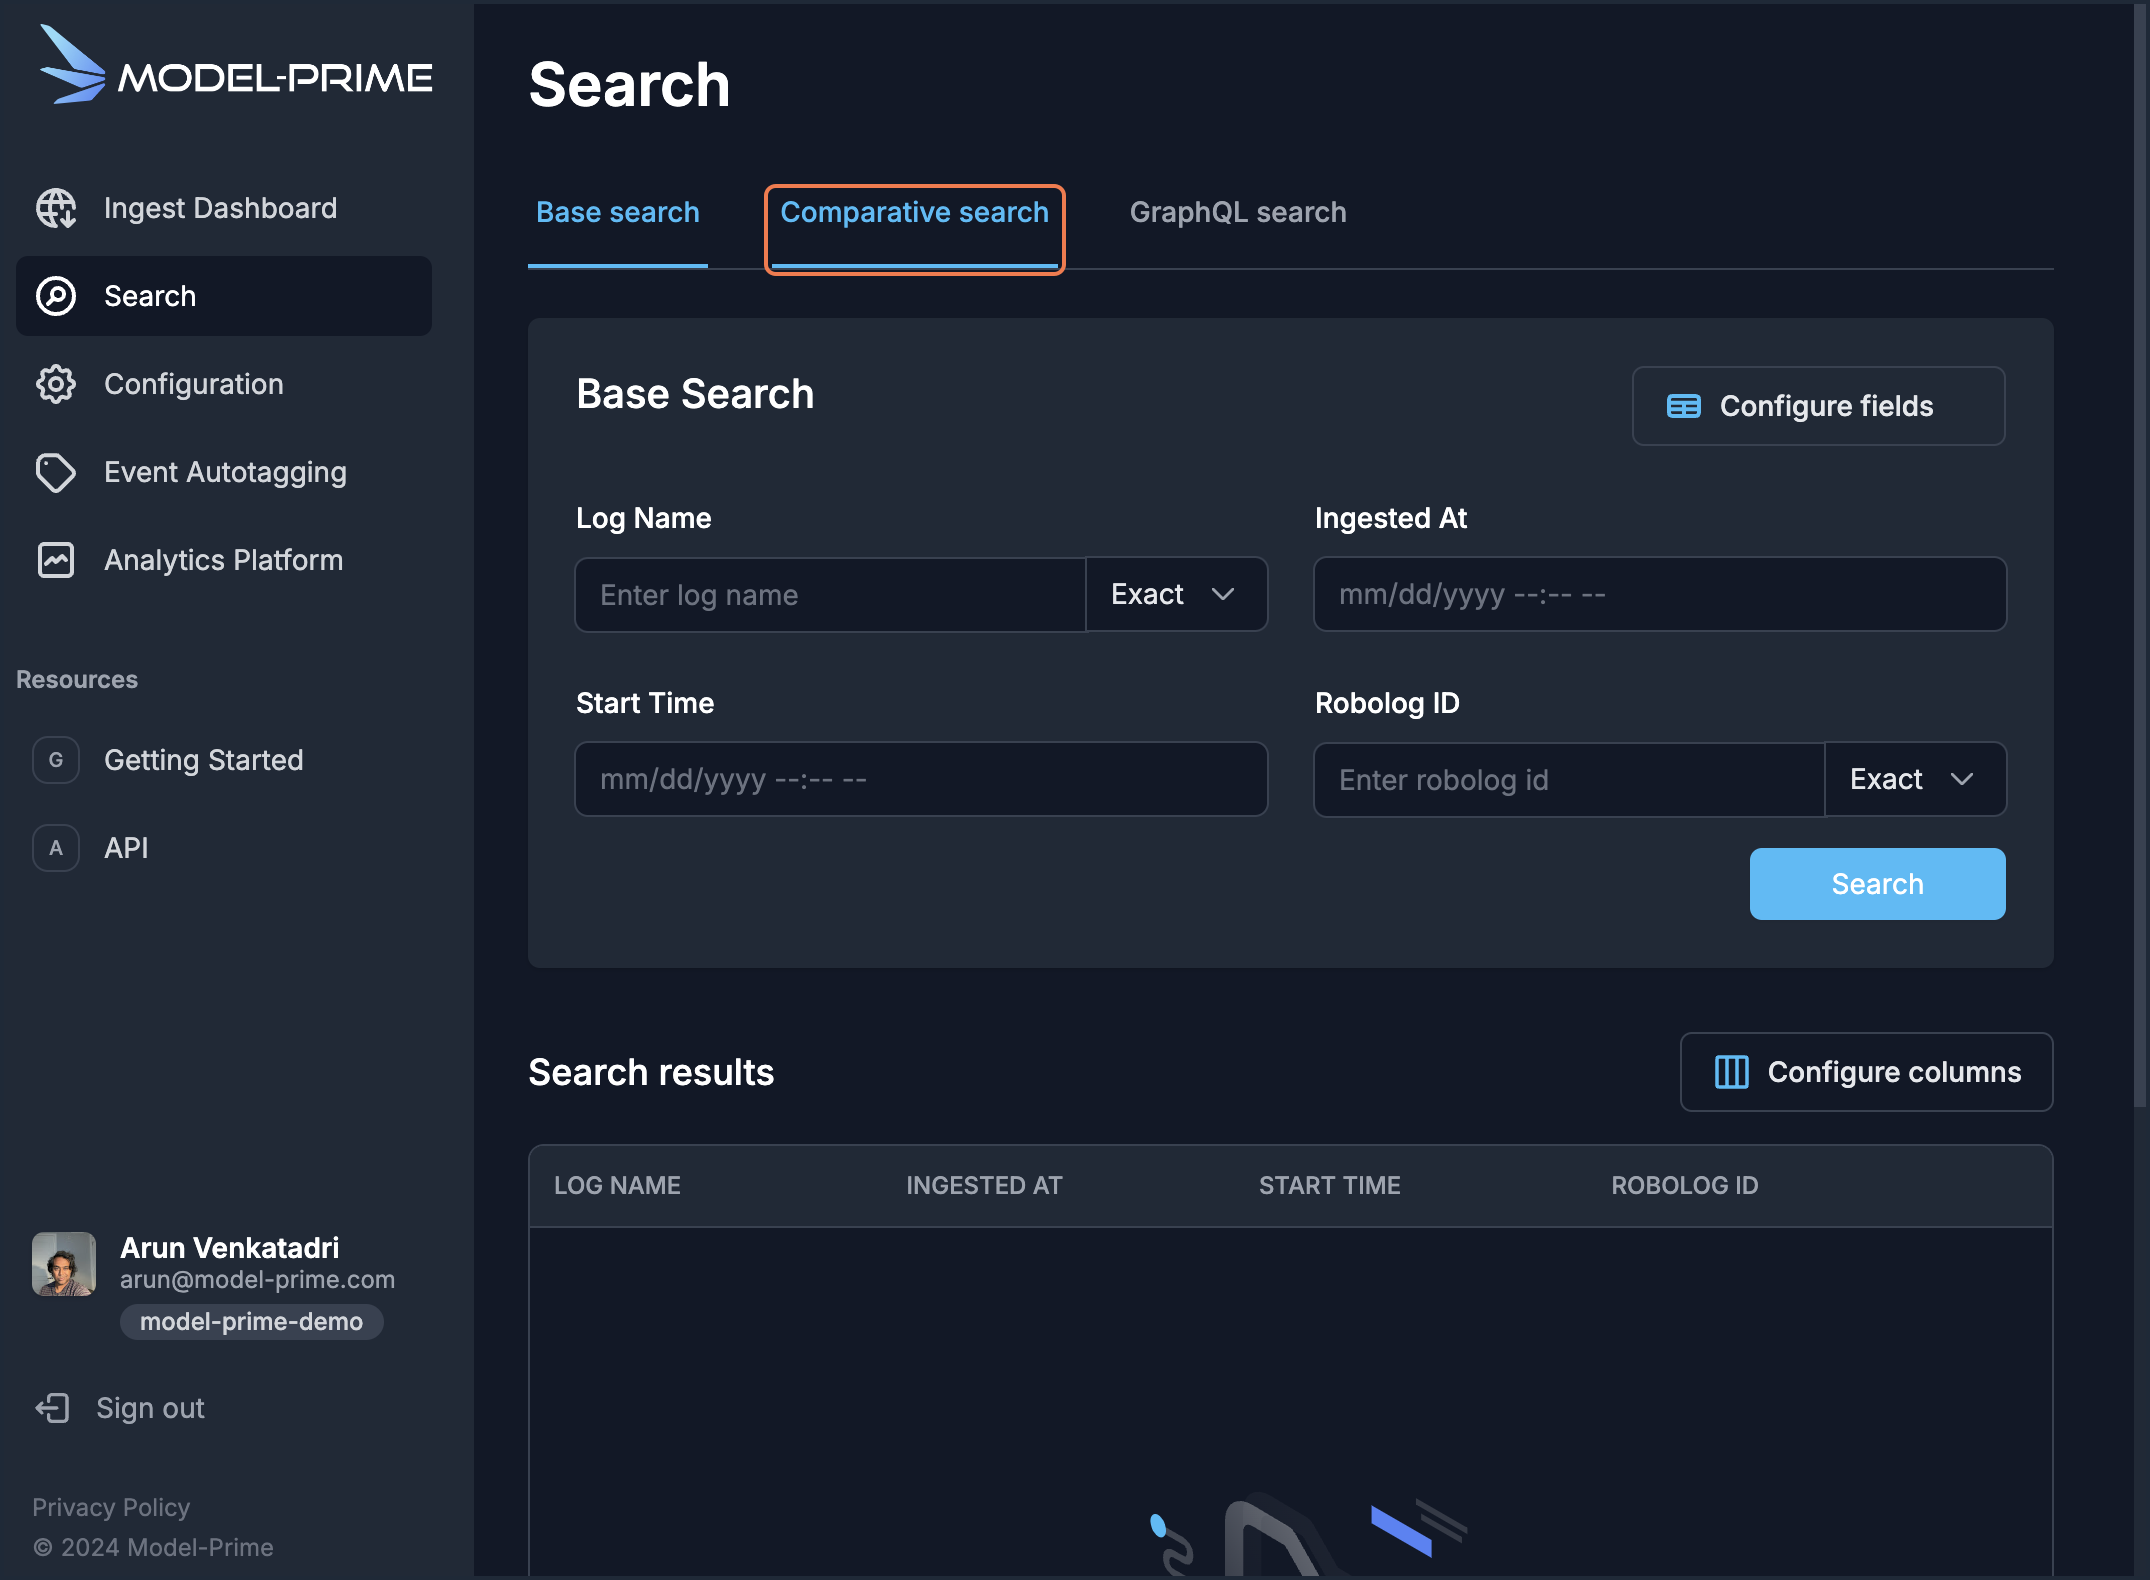
- Click on the
Comparative searchtab.
-
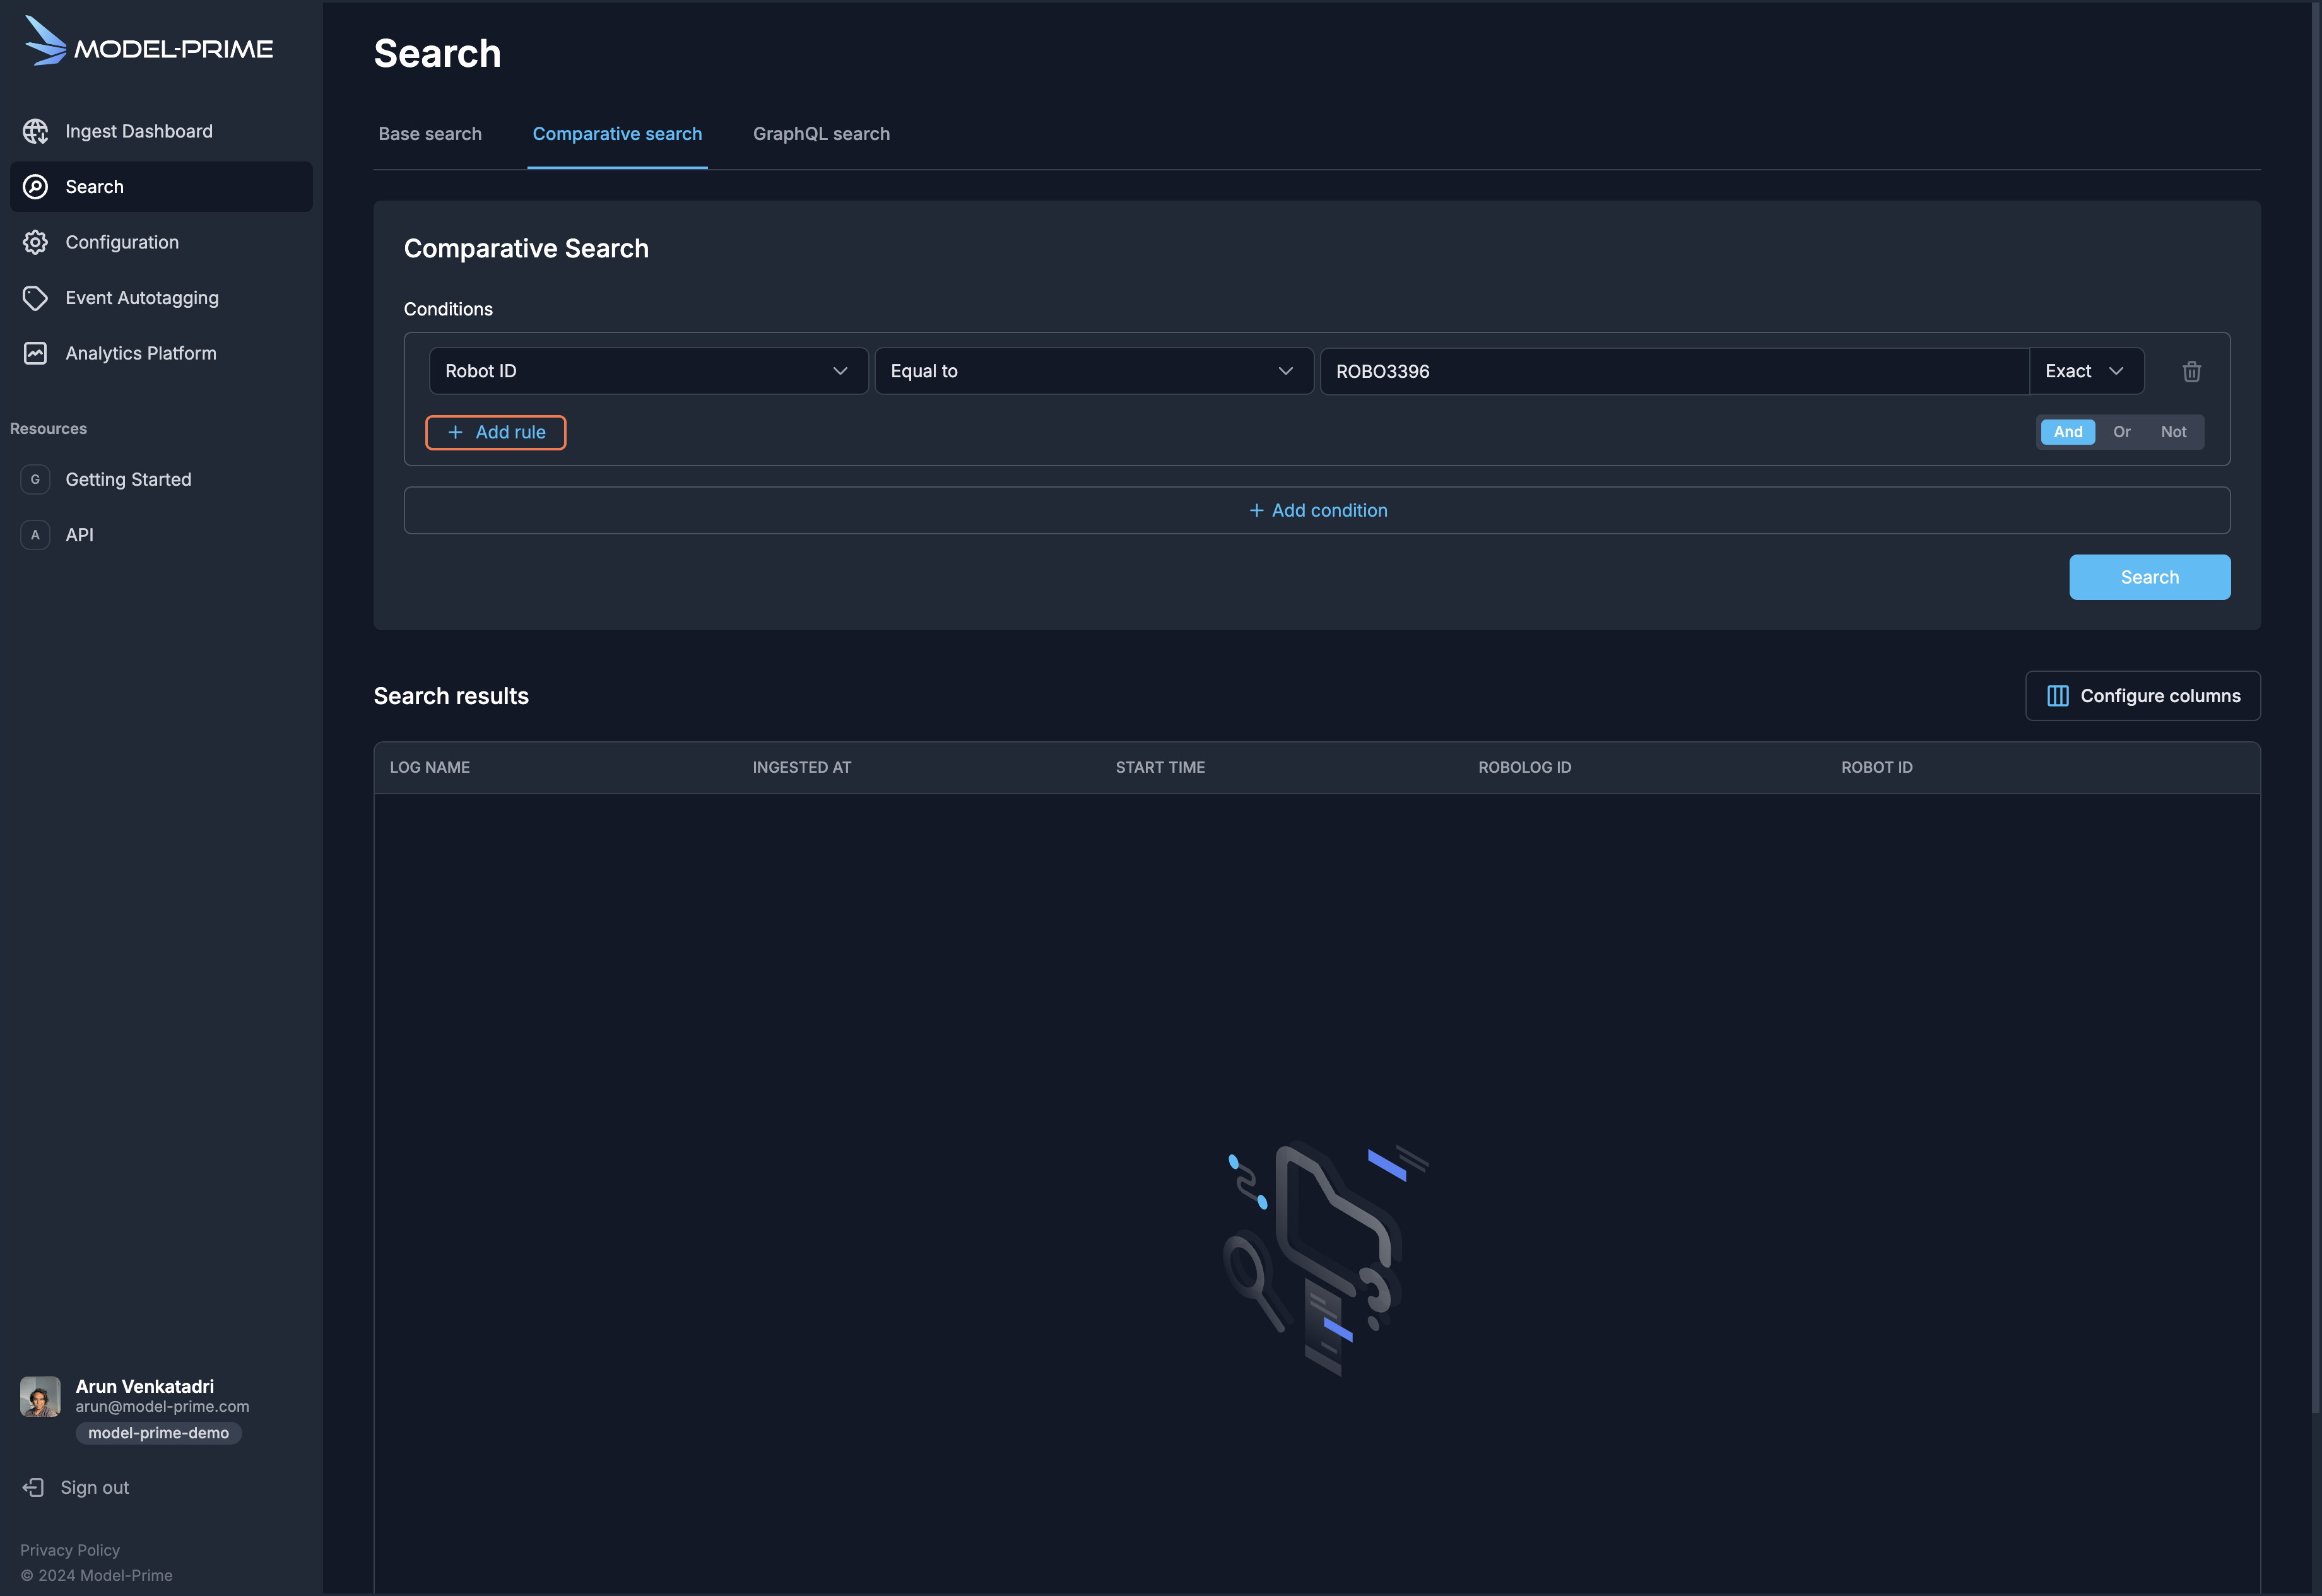
In the
Conditionssection, click on theSelect ruledropdown and selectRobot ID. -
Select the
Equal tocondition and type or pasteROBO3396into the filter value field. -
To narrow down the search to the date of failure, add a date rule. Click
+ Add rule.
-
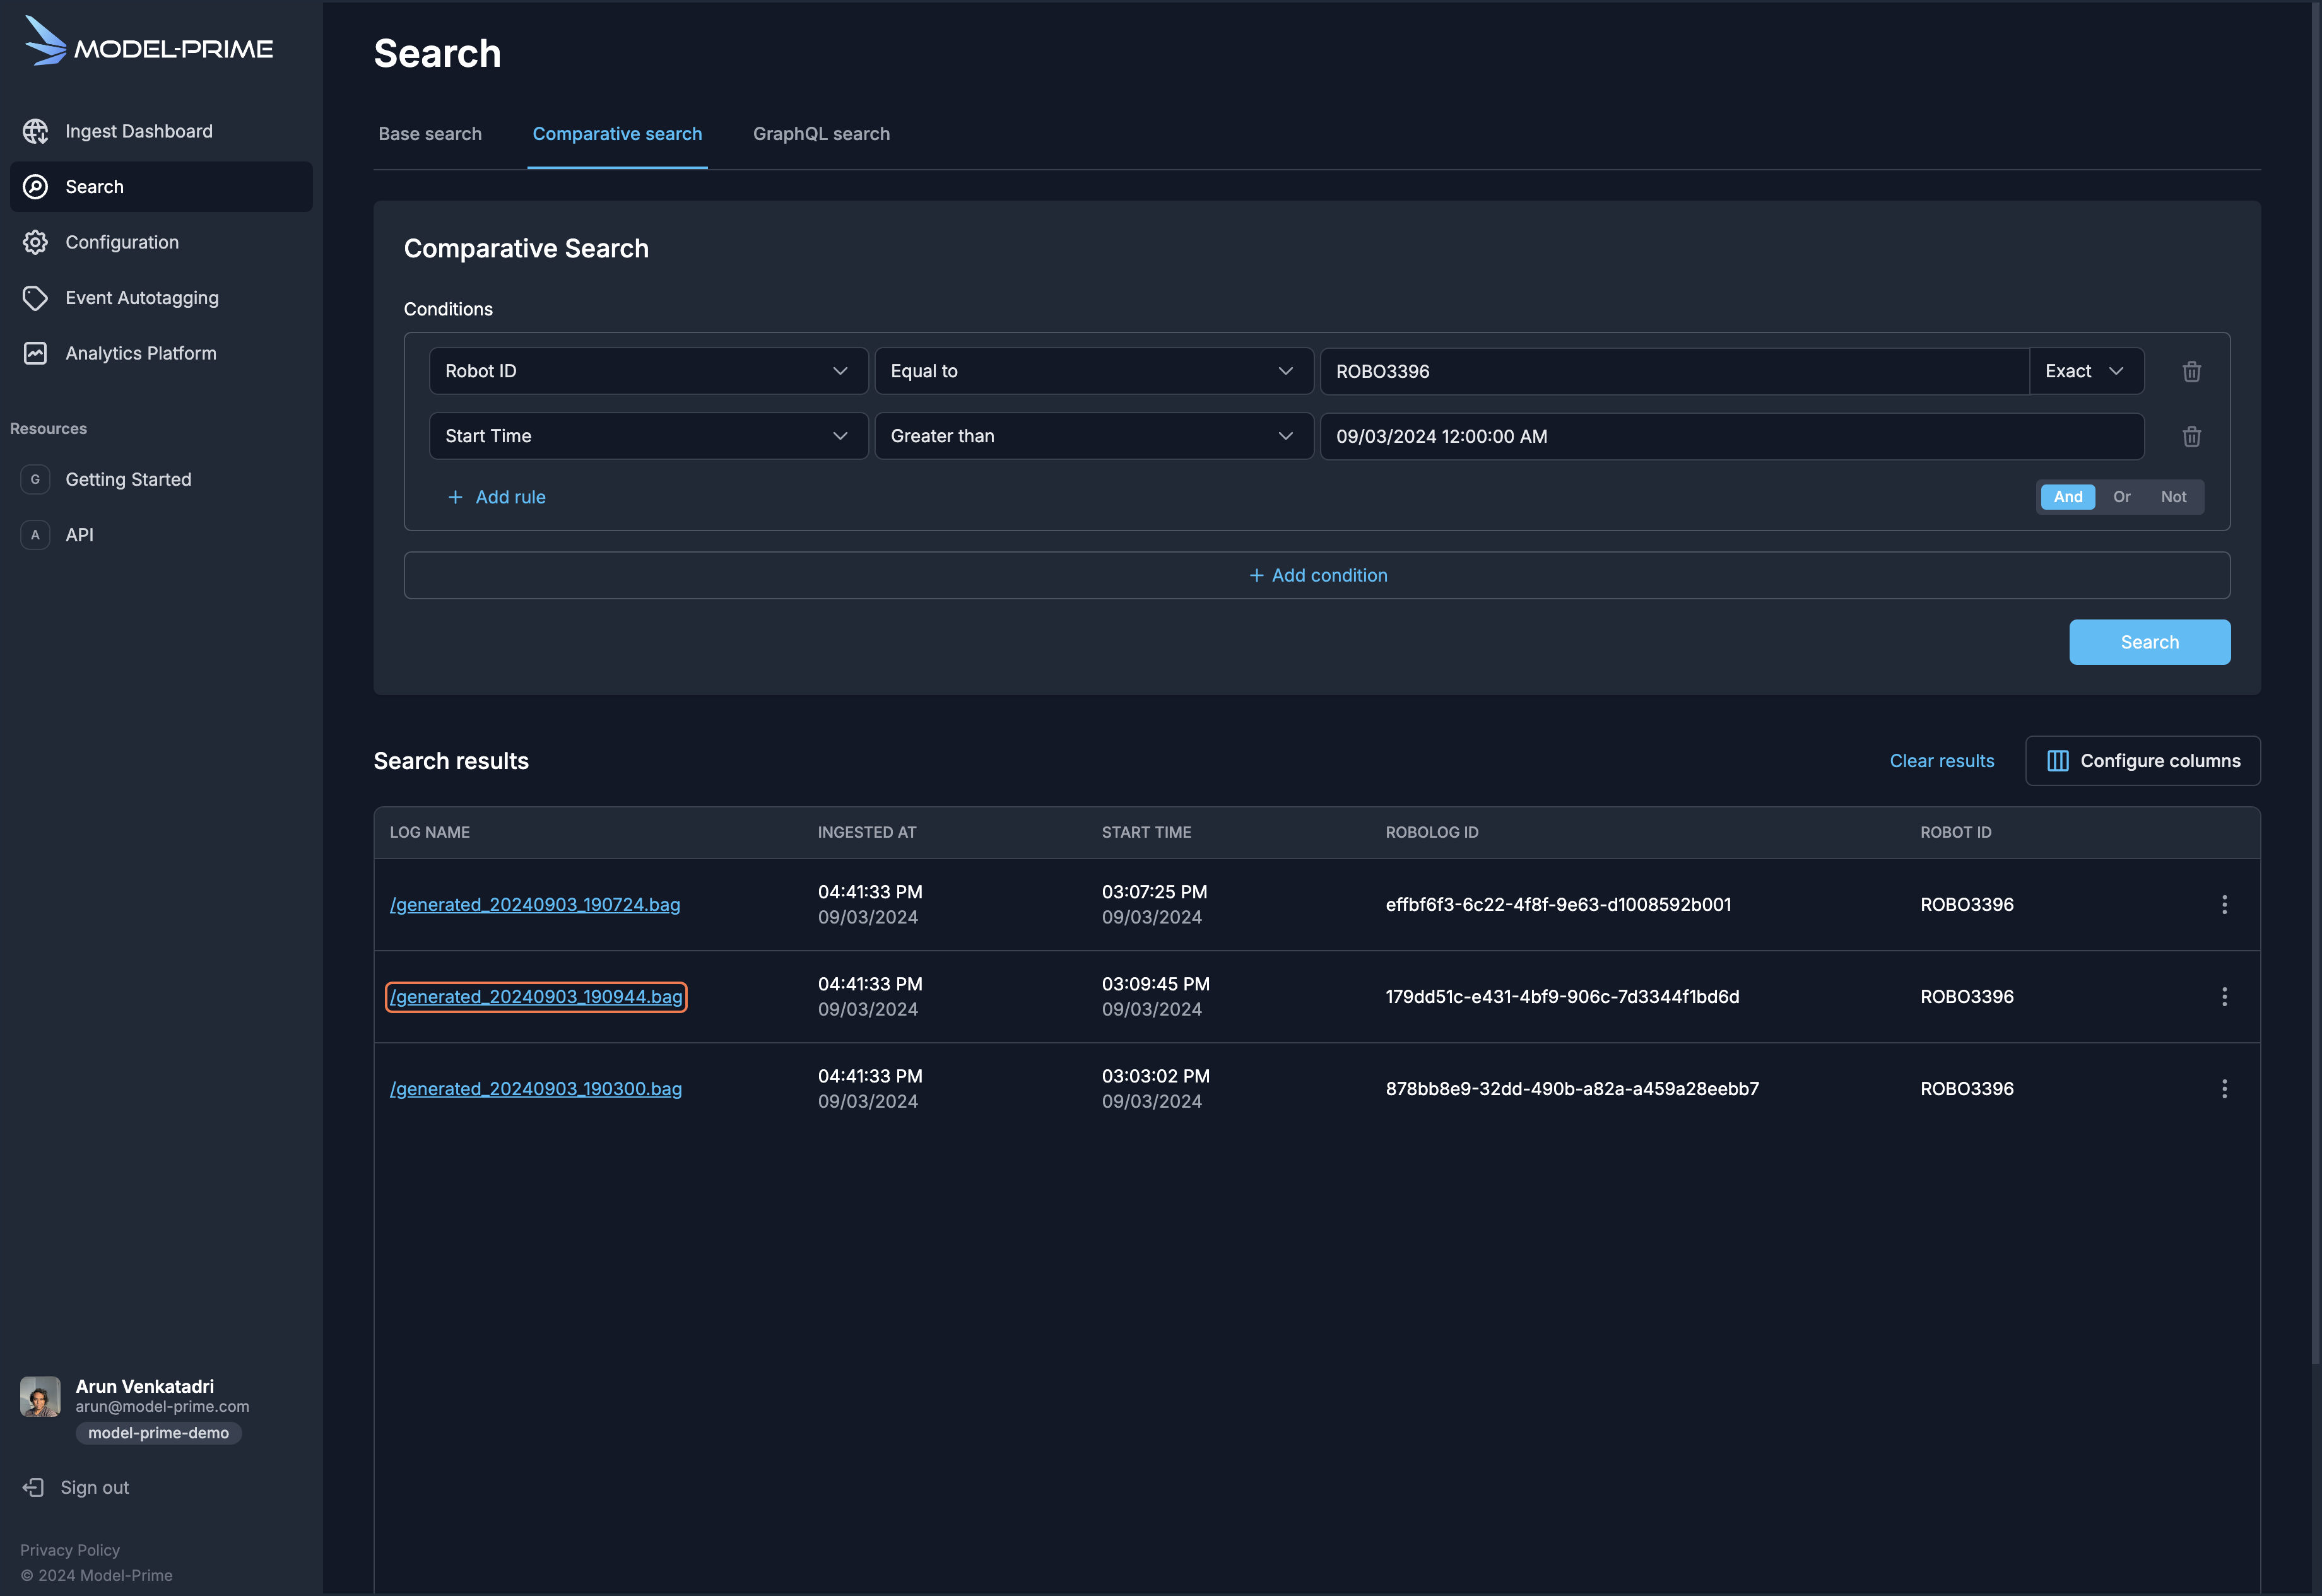
Click on the
Select Ruledropdown and selectStart time. -
Select the
Greater thancondition and select09/03/2024in the date picker. It will default to09/03/2024 12:00:00 AM. -
Click on the
Searchbutton. In the results pane below, you will see all of the logs generated by robotROBO3396on09/03/2024or later. You should see three logs.
NOTE: The
ROBOLOG IDs you see will be different from the screenshots provided, as they are unique for your demo organization. However, the robolog names will be the same.
- Click on the log name
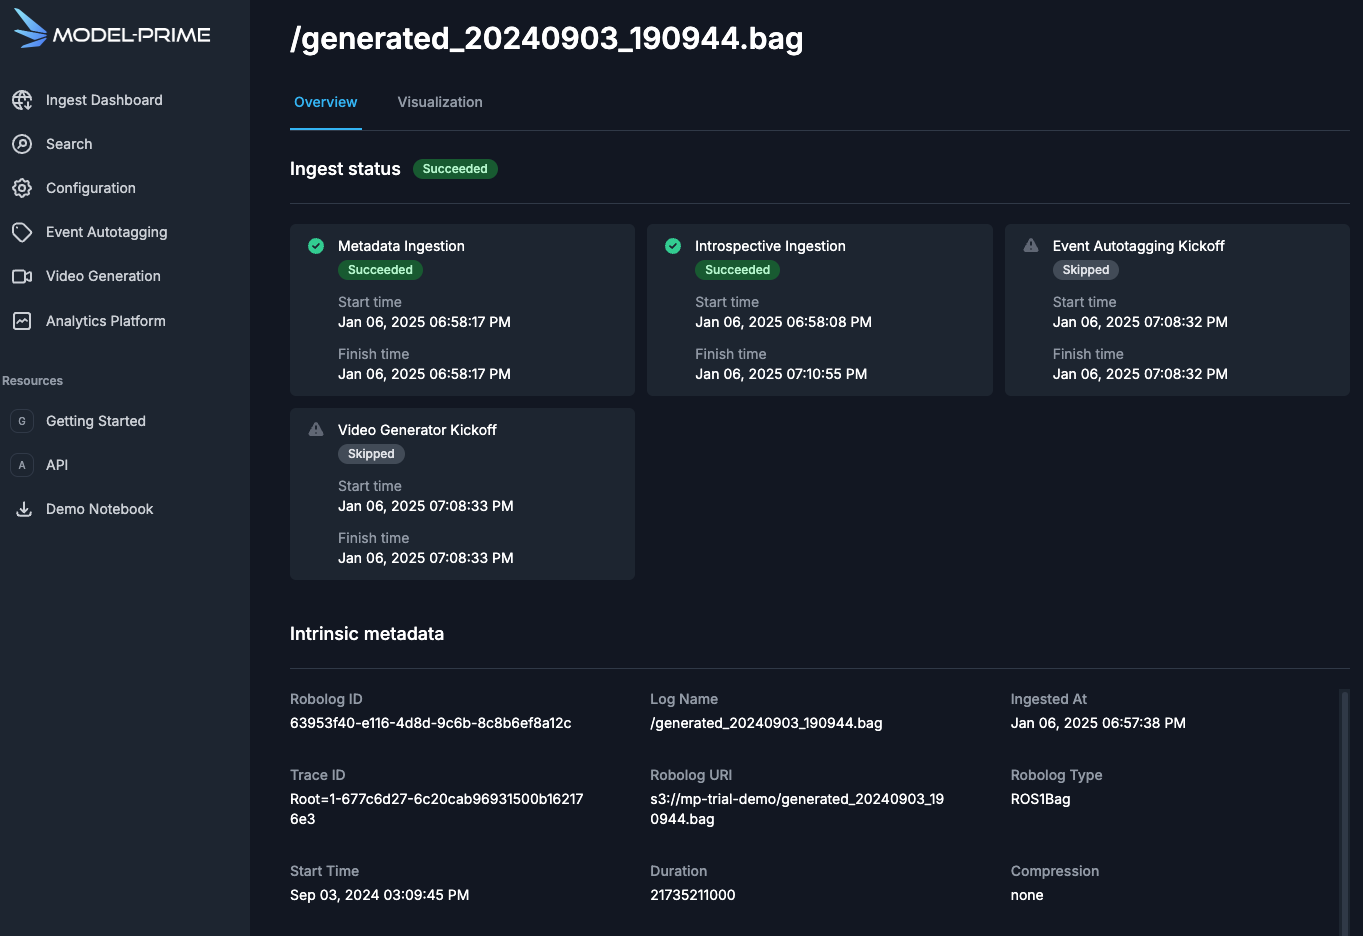
/generated_20240903_190944.bag. This will take you to the Metadata Details page for that log.
- On the Metadata Details page, you can see the metadata attributes for the log, including the Model-Prime
Robolog ID,Robolog URI,Duration, and channel information. You can also see the status of Model-Prime processes such as Metadata Ingestion, which populates the metadata attributes, and Introspective Ingestion, which prepares log message data for analysis.
Knowing that temperature may impact performance of optical encoders, you can explore the temperature from the robot's last run prior to the failure by visualizing the channel data in this log.
-
Click on the
Visualizationtab. -
In the
Log visualizationpane, click on+ Add channel -
Select the
sensor_msgs/TemperatureChannel Type. The/terrible_temperatureChannel Name will populate. Select thetemperaturedata path.
You will see the temperature plot appear in the graph below.
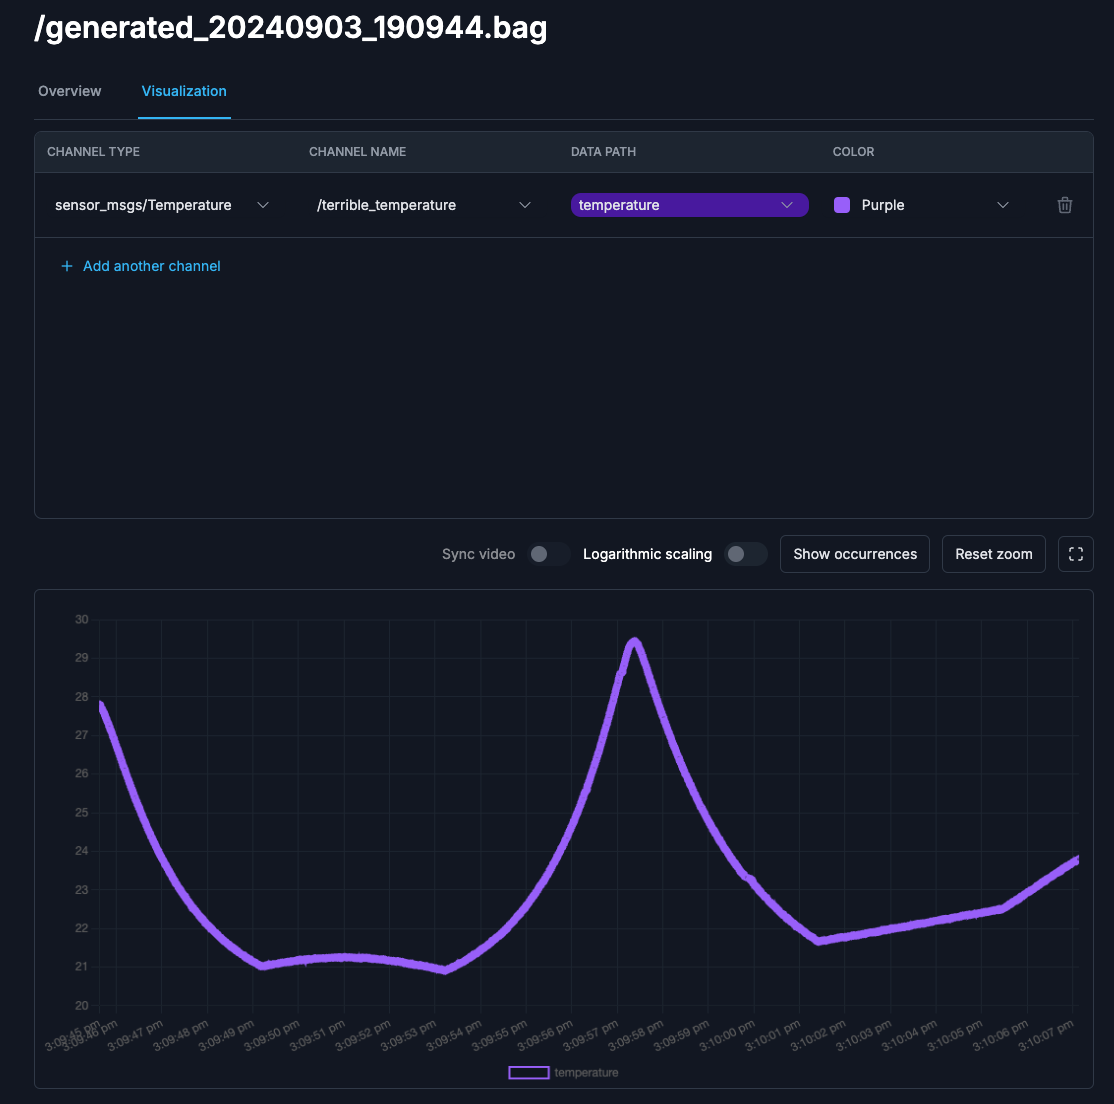
The plot shows some temperature spikes that warrant further investigation. To explore and analyze data across multiple logs from this robot, you can use a SageMaker Notebook that runs against the Model-Prime Analytics Platform.